
The air travel industry witnessed a significant recovery in 2023, with passenger numbers reaching nearly 8.5 billion globally. This represents a remarkable 27.2% increase from 2022 and signifies a near 94% return to pre-pandemic levels (2019).
Notably, international traffic played a key role in this growth, surging by 36.5% compared to 2022 and recovering to 90.4% of 2019 figures. Domestic travel also saw a healthy increase of 20.2%, reaching 96.8% of pre-pandemic levels, according to the Airports Council International (ACI) World.
Hartsfield-Jackson Atlanta International Airport (ATL) has retained its position as the busiest airport in the world, with 104.6 million passengers passing through its gates in 2023, representing an 11.2% increase from the previous year.
Passenger Traffic
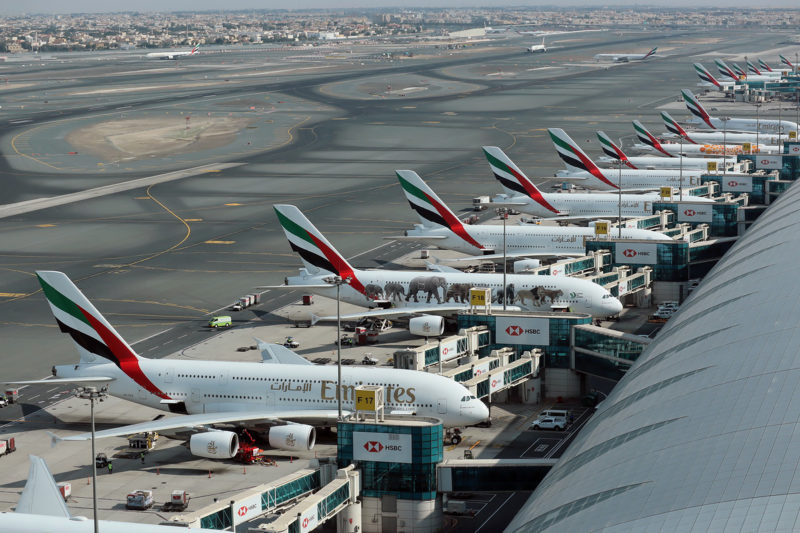
The dominance of international travel is reflected in the rankings of the world’s busiest airports in 2023. While Atlanta International Airport (ATL) retained its top spot, Dubai International Airport (DXB) climbed to second place for the first time, surpassing Dallas/Fort Worth International Airport (DFW) which ranked third.
Another notable change is the impressive rise of Tokyo Haneda International Airport (HND). It jumped from 16th in 2022 to 5th in 2023, showcasing a significant increase in passenger traffic. Airports in Istanbul (IST) and New Delhi (DEL) also maintained strong positions, indicating continued growth and resilience in these regions.
Top 10 Airports in the World by Passenger
| 2023 Rankings | Airport | Passengers | % CHANGE vs 2022 | % CHANGE vs 2019 | 2022 Rankings | 2019 Rankings |
|---|---|---|---|---|---|---|
| 1 | Atlanta (ATL) | 104,653,451 | 11.7 | -5.3 | 1 | 1 |
| 2 | Dubai International (DXB) | 86,994,365 | 31.7 | 0.7 | 5 | 4 |
| 3 | Dallas/Fort Worth (DFW) | 81,755,538 | 11.4 | 8.9 | 2 | 10 |
| 4 | London Heathrow (LHR) | 79,183,364 | 28.5 | -2.1 | 8 | 7 |
| 5 | Tokyo-Haneda (HND) | 78,719,302 | 55.1 | -7.9 | 16 | 5 |
| 6 | Denver (DEN) | 77,837,917 | 12.3 | 12.8 | 3 | 16 |
| 7 | Istanbul (IST) | 76,027,321 | 18.3 | 45.7 | 7 | 28 |
| 8 | Los Angeles (LAX) | 75,050,875 | 13.8 | -14.8 | 6 | 3 |
| 9 | Chicago (ORD) | 73,894,226 | 8.1 | -12.7 | 4 | 6 |
| 10 | New Delhi (DEL) | 72,214,841 | 21.4 | 5.4 | 9 | 17 |
Top 10 Airports in the World by International Passenger
| 2023 Rankings | Airport | Passengers | % CHANGE vs 2022 | % CHANGE vs 2019 | 2022 Rankings | 2019 Rankings |
|---|---|---|---|---|---|---|
| 1 | Dubai International (DXB) | 86,994,365 | 31.7 | 0.8 | 1 | 1 |
| 2 | London Heathrow (LHR) | 74,909,019 | 28.6 | -1.5 | 2 | 2 |
| 3 | Amsterdam Schipol (AMS) | 61,882,546 | 17.9 | -13.7 | 3 | 3 |
| 4 | Paris (CDG) | 61,412,198 | 18.6 | -12.1 | 4 | 6 |
| 5 | Singapore Changi (SIN) | 58,411,000 | 83.1 | -13.6 | 9 | 7 |
| 6 | Istanbul (IST) | 58,232,674 | 20 | 47.1 | 5 | 14 |
| 7 | Seoul Incheon (ICN) | 55,763,768 | 212.9 | -21 | 32 | 5 |
| 8 | Frankfurt (FRA) | 54,089,293 | 20.8 | -14.2 | 6 | 8 |
| 9 | Hamad International (DOH) | 45,913,805 | 28.5 | 18.4 | 8 | 15 |
| 10 | Madrid (MAD) | 43,799,968 | 20.9 | -2.5 | 7 | 11 |
Aircraft Movement
In 2023, Global aircraft movements reached nearly 95 million, reflecting an 11.8% increase from 2022. This represents a recovery of 92.7% compared to pre-pandemic levels.
Unsurprisingly, Atlanta International Airport again secured the top spot with 775,818 aircraft movements, followed by Chicago O’Hare Airport (ORD) and Dallas/Fort Worth International Airport (DFW). The top 10 busiest airports for aircraft movements handled over 6% of global traffic (roughly 6 million movements). This represents a 7.4% increase from 2022 and a 96.4% recovery from 2019.
| 2023 Rankings | Airport | Aircraft Movements | % CHANGE vs 2022 | % CHANGE vs 2019 | 2022 Rankings | 2019 Rankings |
|---|---|---|---|---|---|---|
| 1 | Atlanta (ATL) | 775,818 | 7.1 | -14.2 | 1 | 2 |
| 2 | Chicago (ORD) | 720,582 | 1.3 | -21.7 | 2 | 1 |
| 3 | Dallas/Fort Worth (DFW) | 689,569 | 5 | -4.2 | 3 | 3 |
| 4 | Denver (DEN) | 657,218 | 8.1 | 4 | 4 | 5 |
| 5 | Las Vegas (LAS) | 611,806 | 5.3 | 10.6 | 5 | 8 |
| 6 | Los Angeles (LAX) | 575,097 | 3.3 | -16.8 | 6 | 4 |
| 7 | Charlotte, (CLT) | 539,066 | 6.6 | -6.8 | 7 | 7 |
| 8 | Istanbul (IST) | 505,968 | 18.8 | 53.4 | 10 | 54 |
| 9 | New York (JFK) | 481,075 | 7.2 | 5.5 | 9 | 21 |
| 10 | Tokyo-Haneda (HND) | 464,910 | 19.8 | 1.4 | 18 | 19 |
Cargo Traffic
While passenger traffic boomed, air cargo volumes experienced a slight decline in 2023. Compared to 2022, there was a 3.1% decline, bringing the total volume to around 113 million metric tonnes. This can be attributed to ongoing geopolitical tensions and disruptions to global supply chains.
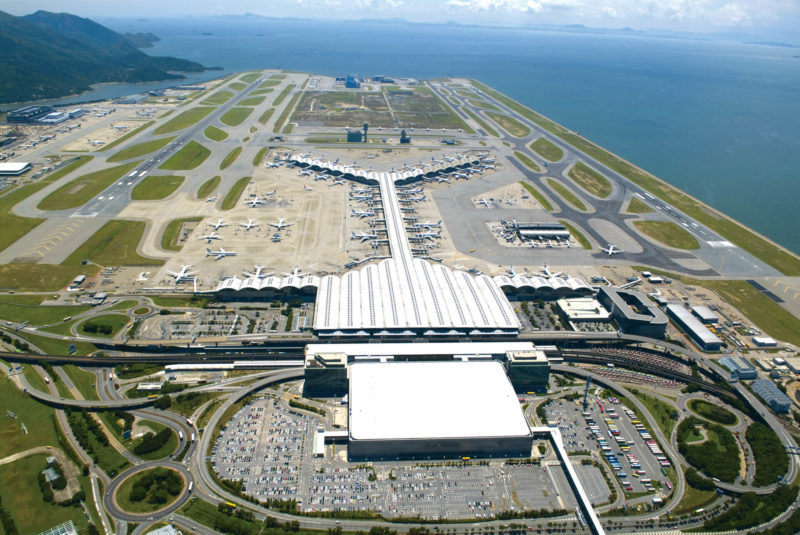
Looking at the top 10 cargo airports, which handle roughly 26% of global volume, there was a 3.5% decrease year-over-year. Despite the decline, Hong Kong International Airport (HKG) maintained its top position, followed by Memphis International Airport (MEM) and Shanghai Pudong International Airport (PVG).
| 2023 Rankings | Airport | Cargo (Metric Tonnes) | % CHANGE vs 2022 | % CHANGE vs 2019 | 2022 Rankings | 2019 Rankings |
|---|---|---|---|---|---|---|
| 1 | Hong Kong (HKG) | 4,331,976 | 3.2 | -9.9 | 1 | 1 |
| 2 | Memphis (MEM) | 3,881,211 | -4 | -10.2 | 2 | 2 |
| 3 | Shanghai (PVG) | 3,440,084 | 10.4 | -5.3 | 4 | 3 |
| 4 | Anchorage (ANC) | 3,380,374 | -2.4 | 23.1 | 3 | 6 |
| 5 | Seoul Incheon (ICN) | 2,744,136 | -6.9 | -0.7 | 6 | 5 |
| 6 | Louisville, (SDF) | 2,727,820 | -11.1 | -2.2 | 5 | 4 |
| 7 | Miami (MIA) | 2,525,591 | 1 | 20.7 | 8 | 12 |
| 8 | Hamad International (DOH) | 2,355,503 | 1.5 | 6.3 | 11 | 8 |
| 9 | Los Angeles (LAX) | 2,130,835 | -14.9 | 1.9 | 9 | 13 |
| 10 | Taipei (TPE) | 2,112,988 | -16.8 | -3.2 | 7 | 9 |
In conclusion, the 2023’s busiest airports paint a promising picture for the air travel industry’s post-pandemic resurgence. Fueled by a surge in international travel, passenger numbers have nearly reached pre-pandemic levels.
Global airports, particularly those adapting to handling international traffic, have witnessed significant growth. While air cargo volumes dipped slightly due to global disruptions, overall aircraft movements continue to climb.
Despite ongoing challenges, the adaptability and resilience showcased by the world’s busiest airports bode well for the future of air travel. As the industry navigates a changing global landscape, these leading hubs offer a beacon of hope for a full recovery and continued growth.
Data Source: ACI, Feature Image via GCMap